by Venchito Tampon Jr | Last Updated on June 28, 2023
Guestographics is publishing visual assets on external industry blogs with the hope of getting contextual links pointing to a website.
Coined by Brian Dean, the said link building strategy has been abused used in acquiring legitimate links to their sites. It’s effective in industries where bloggers want to delight their audience with a new content type (visuals) or want to share data/story/message that deserves to be heard.
A lot of SEO case studies have been published about guestographics. Here’s one article where a blogger used guestographics to grow his pet blog’s organic traffic by 975% within 6 weeks.
To execute this link building strategy, Brian Dean shows a five-step process that you can run smoothly in your industry.
Step 1: Post an infographic on your site
Step 2: Find sites that write about your infographic’s topic
Step 3: Show them your infographic
Step 4: Offer them unique content (“the bribe”)
Step 5: Get your contextual backlinks
I recommend you read Brian’s entire guide to get further details on how to execute each step above.
What is guestographics?
Guestographics, also known as infographic outreach, involve creating and sharing infographics with other websites for them to use as content. It’s a visual approach to guest blogging. By leveraging the power of visual storytelling, guestographics can enhance brand exposure and generate high-quality backlinks for increased website traffic and SEO benefits.
How to do infographic outreach?
Here are four actionable tips to do infographic outreach:
- Utilize email fragments in visual content outreach.
- Leverage infographic promotion with embed boxes.
- Slice out infographics into micro visuals.
- Localize visual data
1. Utilize email fragments in visual content outreach
It’s easy to copy and paste an outreach email template from an SEO blog and replicate it on your own outreach campaign. However, without knowing the principles of why it worked in the first place, it can only give you initial success.
Emails like I like your blog and found you on [insert link source] or I stumbled upon you on [source] and thought that you’ll be interested in my infographic hammered many inboxes of industry bloggers and publishers. They mostly go to a spam folder and don’t help get returns in email outreach.
The way to stand out in email is to use a compelling, short, and personalized subject line such as this SiegeMedia’s subject line format:
[ASSET TYPE] for [WEBSITE]: [POST SUMMARY].
The reason it’s effective is that publishers can easily glance at what content type you’re trying to pitch to and what your asset contains by simply reading your subject line.
A one-punch line can help improve your emails’ open rates.
But effective outreach doesn’t stop there.
It’s important to include specific details that only that website has (Ross calls it email fragments) which gives a personalized hook to your email that will make it look like a one-time sent-off email rather than a blast-off one.
To test how important email fragments are in linker outreach, I sent a bad outreach email to a high-authority industry publisher with their Website Name not correctly spelled out. Scheduled it to be sent at peak hours.
Then after an hour, I received a response from the editor.
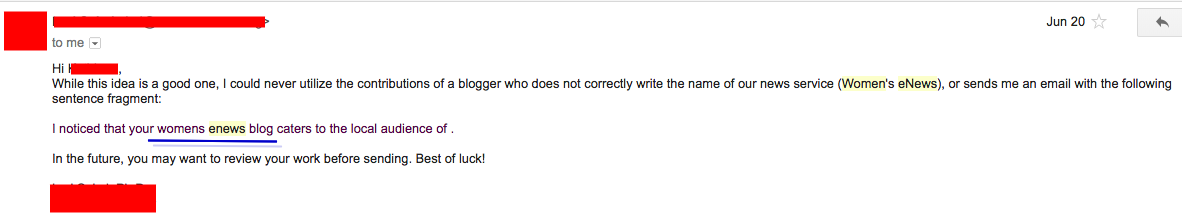
Negative.
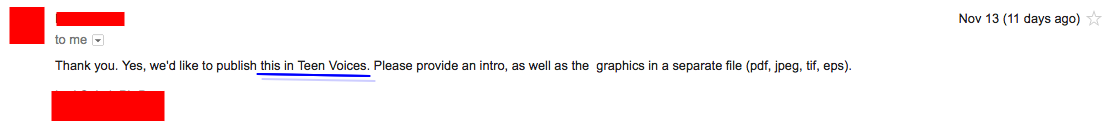
Five months later, I sent a similar pitch (but with the correct spelling of the website’s name) to the same editor.
This time, I received a positive response wanting to publish the visual asset that we’ve created. They are asking for a custom intro and jpg/png version of the infographic.
That may be a lame test (just one email) but I believe there are hundreds (if not thousands) of publishers checking their email inbox and choosing which email deserves a response based on how the pitch is structured and personalized.
The more you include email fragments in your pitch, the better results you’ll get.
2. Leverage infographic promotion with embed boxes.
Publishing your infographic is finishing the first half of the battle (content creation). You have to put more eyeballs to it in order to get traction and naturally earn links – that’s the second half (content promotion).
As you know, people put embed boxes after infographics. This allows other bloggers to republish the exact visual asset on their own blogs without asking for permission from the original publisher.
This approach initiates the promotion of the visual asset.
Now take this step to the next level by giving a code to bloggers that’ll allow them to put their own embed box on their blogs when republishing your visual asset. The publisher who then embeds the asset will also have an embed code with your details.
When bloggers look at your republished content and are interested to do the same on their own blogs, it’s easy for them to republish it.
That way, it multiplies the promotion two times without having to reach out to bloggers who have read/connected with republishers.
When you pitch bloggers, you only give them an attachment of the image (png/jpg) for them to upload it on their sites. But it’d be much easier for them to publish the asset you just send them a code.
The code should contain not only the image but also an embed code after the image. The code should look like this:
Let bloggers share the opportunity of links with you in the embed code. It looks like they’ve partnered with you in the promotion (co-marketing) when the visual asset is republished on another blog.
Customize the code by replacing Blogger with the Brand Name of the blogger and Your Blog with Your Brand plus links back to respective sites.
It’s a win-win situation. You get a link, the blogger acquires a link as well.
3. Slice out infographics into micro visuals.
I normally see long infographics that require several mouse scrolls to see the entire image. It’s tiring to look at it on your screen, right?
While this denotes authority in some industries (because it’s filled with a lot of data), what I’ve realized is that not all visitors will dare to check all the details inside the image. They only check the title and get the important facts.
One approach that you can do to not overwhelm your audience with too much content is to slice out a long infographic into two to even four micro images that won’t break the entire message of the content, but rather help visitors pleasingly get each detail on a micro-level.
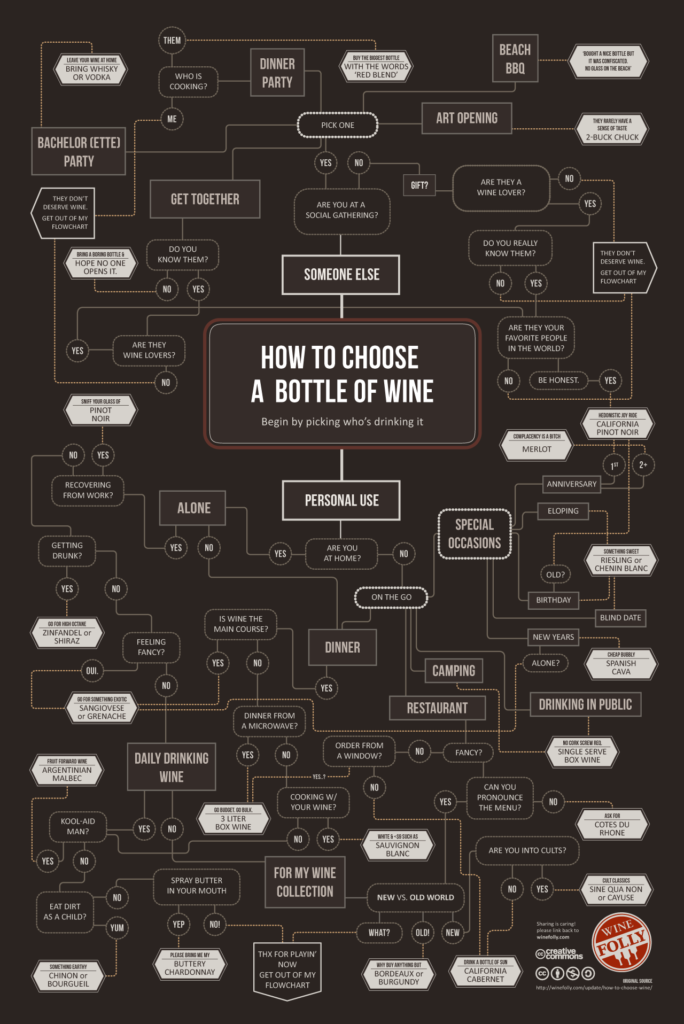
However, it may not be applicable to all types of infographics, such as the case with instructographics or how-to visual assets because it obviously breaks the process of how to complete/do a “thing” (e.g. how to choose a bottle of wine).
Nonetheless, there are infographics that you can break down into micro pieces, like those with five or more data points, that are contextually related but can be divided into two. For example, “How Technology in City1, City2 and City3 Impacts Teen Dating and Women Violence”, you can create microimages for Teen Dating and Women Violence. This is the case when both these two main data points can stand out independently in messaging.
4. Localize visual data
Local links still play a huge role in ranking a local website for city-specific keywords.
There are a lot of link building strategies out there that help you build local backlinks, such as local sponsorships (events, local clubs, schools), local alumni, student, and employee discount programs.
I’ll let you in on a secret. There’s one link building tactic that is underrated in the SEO community – that is, local infographics creation and promotion.
It’s common to see an industry-specific infographic, but having both industry-specific and local-targeted visuals is rare.
Now the question is, how you can localize industry-specific visual data?
The first step is to find a local content source. You can use your company’s internal data if you have one. But if you’re looking for an external source, you may search for available content in public data sites below:
- https://www.data.gov/
- https://socrata.com/resources/
- https://datahub.io/
- http://data.worldbank.org/
- https://www.reddit.com/r/datasets/
Scour out these sites using local and industry keywords and see if there’s a local and relevant public data source.
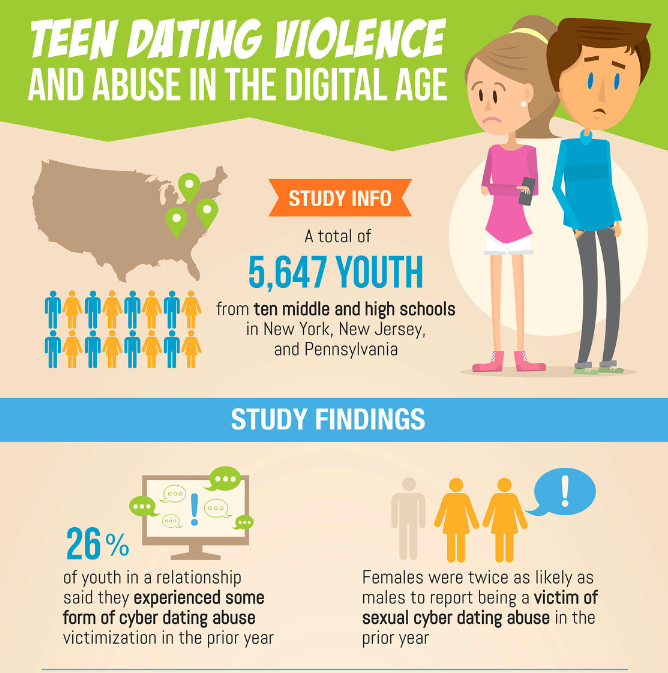
As an example, we’ve sourced out a research study about teen dating, abuse, and bullying in New York, New Jersey, and Pennsylvania by using the keyword, “bullying”.
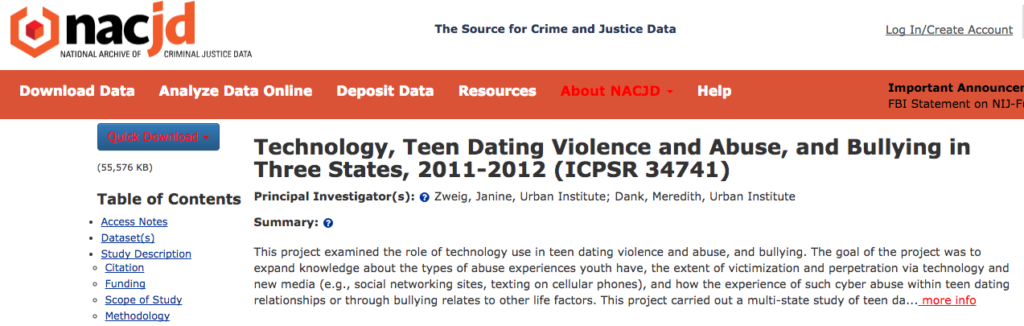
The next step is to assess the relevance and credibility of the public data piece by looking at the version history. This helps you check whether the information is updated for the current year.
Lastly, transform the public data into visual data either by hiring a freelance infographic designer or designing it yourself.
I hope this four-tips article gives you some spark in using guestographics effectively as one of your main-go link building strategies.
If you liked this post, subscribe to our newsletter and follow me on @venchito14.
Need help with your link building campaigns? Check out our link building services here.
Guestographics Frequently Asked Questions
How do I get backlinks from infographics?
To get backlinks from infographics, create visually appealing and informative infographics related to your industry. Embed the infographic on your website and allowed others to easily share it by providing an embed code. Reach out to relevant websites and bloggers in your niche, offering the infographic as valuable content they can share on their own sites while attributing credit back to your website. This approach can help generate high-quality backlinks.
What is the backlinks in SEO?
In SEO, backlinks are when one website links to another using anchor text. For example, you might find an article that references and links to another source. You can easily find examples of website backlinks all over the internet, particularly on popular blog sites that link to relevant content. Backlinks are crucial in improving search engine rankings and increasing website visibility.
What are the 7 common types of infographics?
There are 7 common types of infographics: timeline, data visualization, anatomy, process/how-to, comparison, list, and map. Incorporating the right type of infographic into your content is crucial for successful and effective content marketing. Infographics can visually communicate complex information concisely and engagingly, making them an invaluable tool for businesses and marketers.
What are the 3 types of infographics?
The three types of infographics you should use are statistical, informational, and process-based. Statistical infographics are based on data and numbers, while informational infographics use text-based information. Process infographics illustrate step-by-step processes. These types of infographics are popular and effective for conveying information visually.
What are the 7 parts of infographics?
The seven key components of an infographic include story, style, simplicity, size, stats, shareability, and sources. Our infographic provides a detailed breakdown of these essential parts and outlines a three-step process for developing a successful infographic (storyboarding, design, and promotion). It also highlights the importance of accompanying blog posts in maximizing the impact of your infographic.
What is the best free infographic maker?
Canva, Snappa, and Venngage are among the best free infographic makers in 2022. These tools offer user-friendly interfaces, a wide range of templates, and design options to create visually appealing infographics.
The Author
How our LINK BUILDING AGENCY builds 250 links/mo consistently using Predictable Link Building Methodology™…

- Using a SIMPLE and PROVEN system
- Using a SCALABLE strategy
- No private blog networks
- No creepy outreach emails